Concrete Asphalt
Abstract
1. Introduction
2. Materials and Methods
2.1. Materials
2.1.1. Aggregates
2.1.2. Polymer Binders
2.2. Sample Preparation
2.3. Testing Methods
2.3.1. Aggregate Feature Measurement
2.3.2. Semi-Circular Bending Test
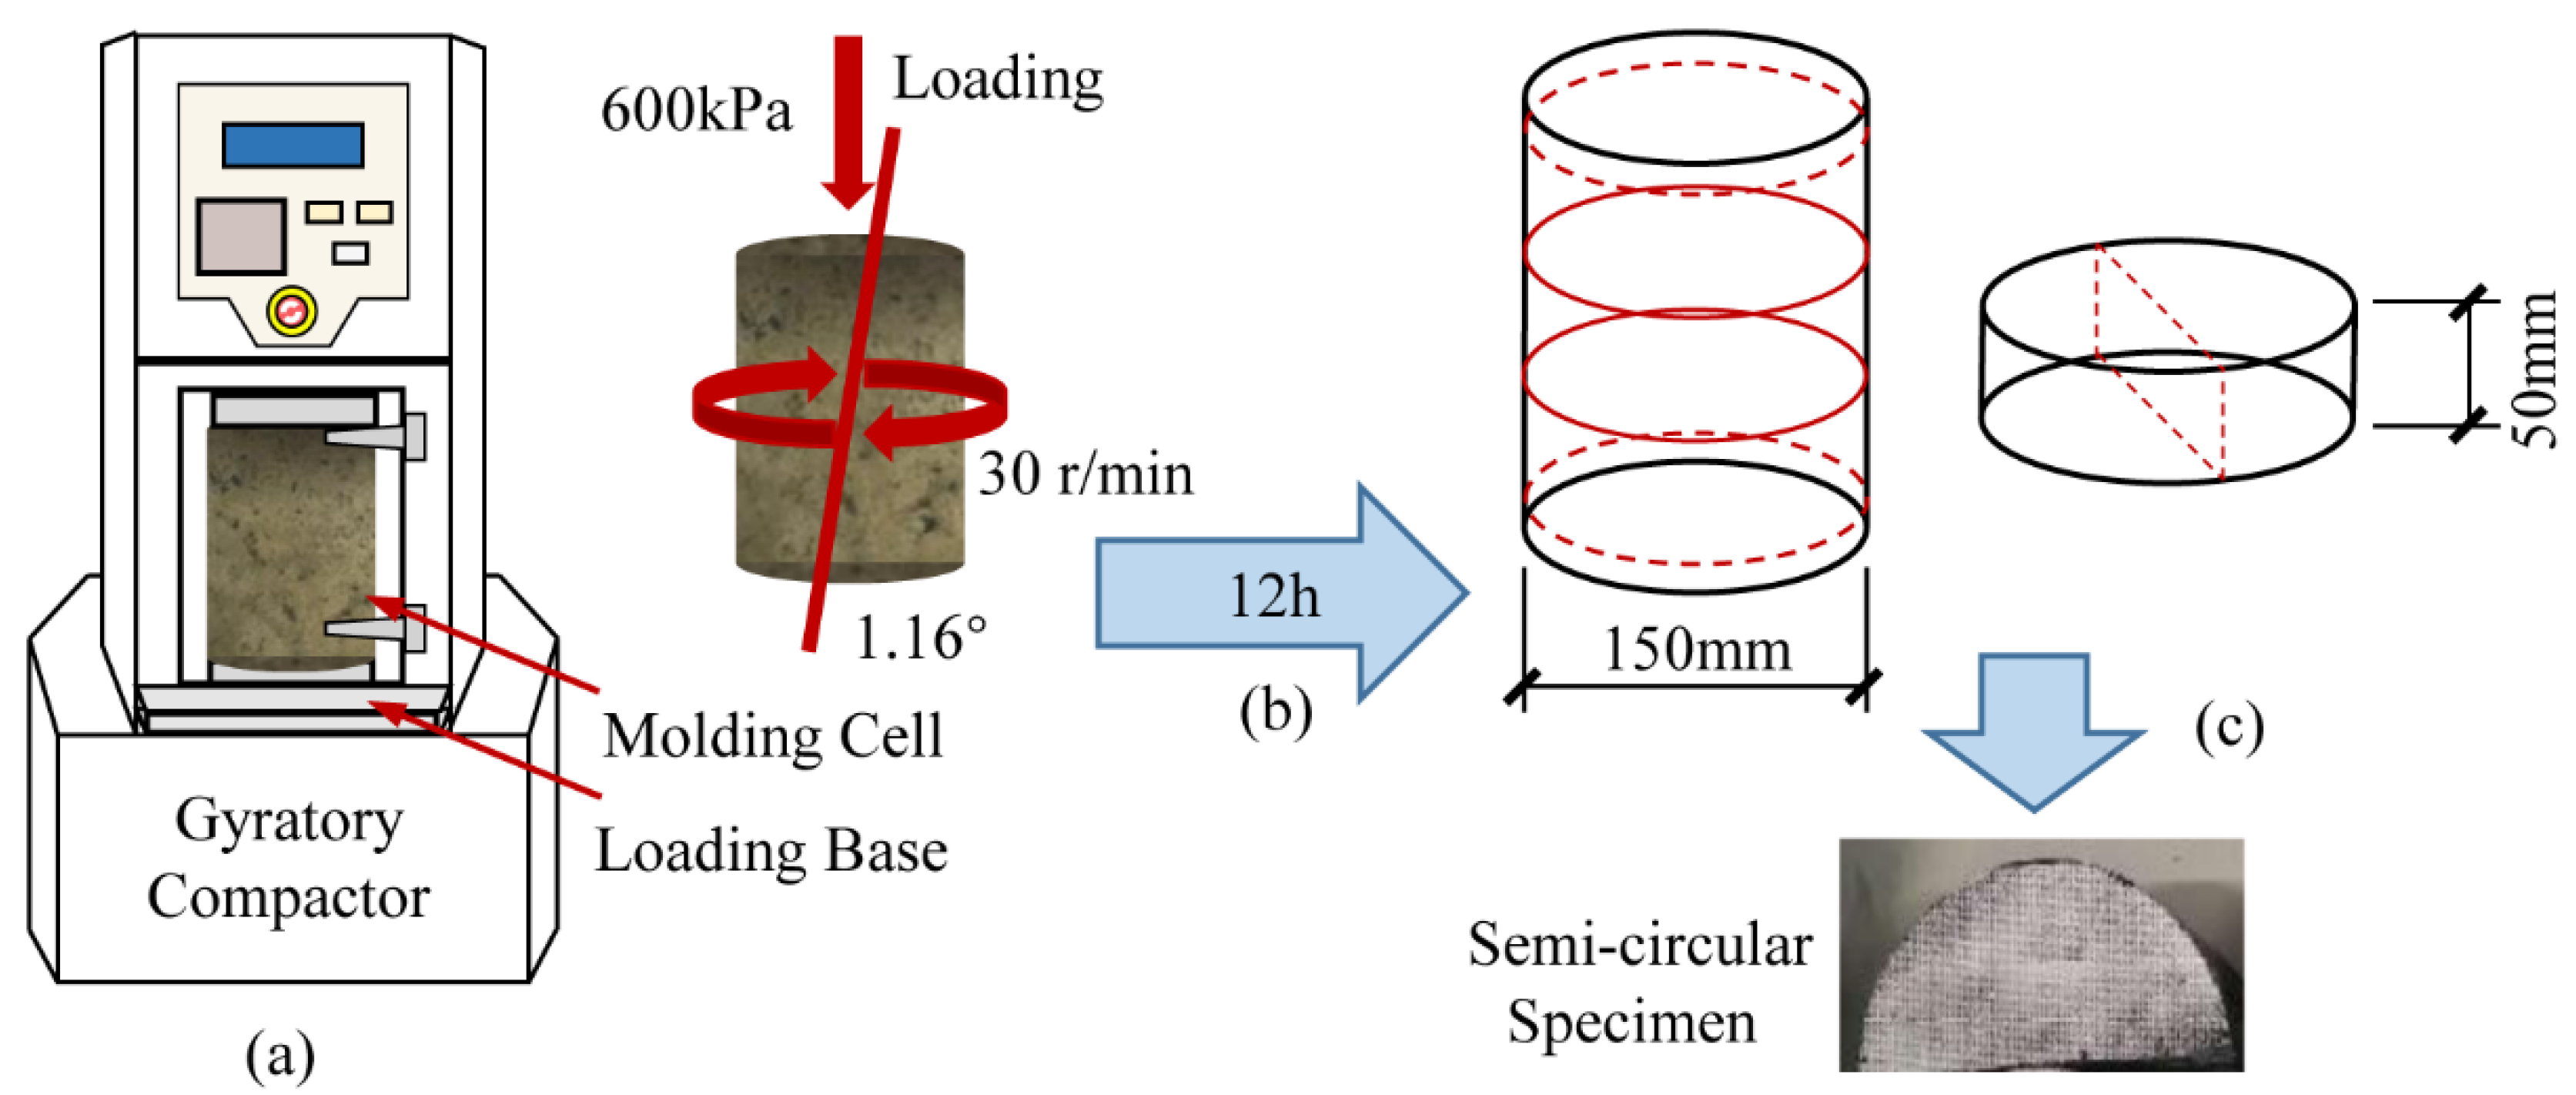
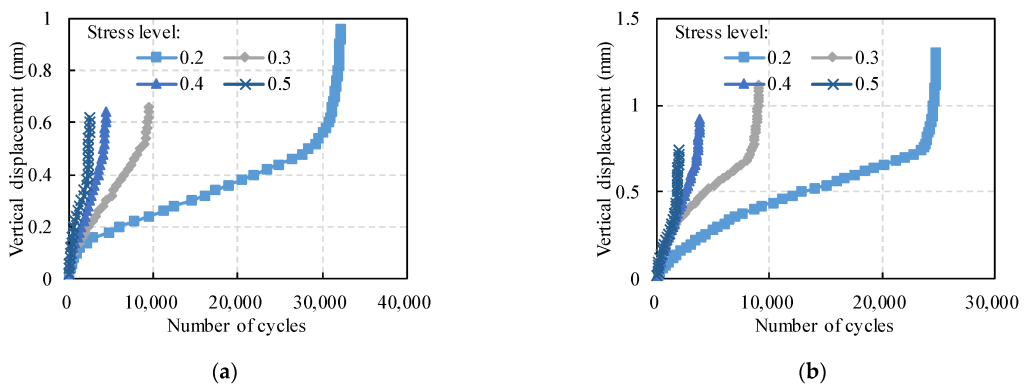
The SCB tests were conducted using the dynamic universal testing machine UTM-100, composed of the constant temperature incubator, loading platform, and servo controller. The selected loading mode was the three-point bending method. The specimens were set on beam support with a loading roller above and two support rollers beneath, all of which were 1 mm in diameter. The distance between the two support rollers was set to 0.8 times the specimen diameter. Before testing, a contact load of 0.2 kN was applied and held for 10 s to ensure uniform contact between the specimen and the loading roller. The test temperature was set to 15 °C, according to the annual temperature gradient variation of Hunan Province. A constant loading rate of 50 mm/min was maintained in the SCB strength tests until the cracking failure of the specimen. The tests stopped as the load dropped to 0.3 kN. The tensile strength of specimens can be determined by SCB tests with single loading. The maximum tensile stress at the bottom of the SCB specimen can be calculated with Equation (1). For the SCB fatigue tests, the loading was applied in the form of haversine waves at a frequency of 10 Hz. The stress levels were set at four different loading stress ratios (0.2, 0.3, 0.4 and 0.5), based on the SCB strength. For each stress level, three parallel tests were performed to ensure the reliability of the fatigue tests. The testing results in the figures represent an average result by parallel tests.
σt=4.976P/TD
3. Results
3.1. SCB Strength Test
Table 4 shows the SCB strength test results under the three different mixing proportions and different polymer contents. The polymer content represents the percentage of polymer binder in the PC by weight. The flexural strength of PC at different sand ratios varies significantly with polymer content. Overall, the flexural strength increases nonlinearly with the increasing polymer content, rapidly at first and then slowly. The main reason is that at low polymer content, the binder cannot completely coat the aggregate surface to develop sufficient interfacial strength. In this study, the flexural strength of PC was less affected by the sand ratio. When the sand ratio is 30%, the bending strengths of ER–PC and PU–PC peaked at 18.82 MPa and 15.24 MPa, respectively. The strength of ER–PC is higher than that of PU–PC, which is consistent with the physical test results of the polymers. As the sand ratio exceeds 30%, the flexural strength of the PC decreases. The main reason is that the excessively low sand ratio causes incompletely filled voids between coarse aggregates. At the same time, an excessive sand ratio reduces the amount of coarse aggregate and increases the total surface area of coarse and fine aggregates, leading to an increased amount of PU. As shown in Table 4, the variability of the strength test was small, with all coefficients of variation (CV) in the parallel tests below 10%. Therefore, considering the economy and design strength requirements, the sand ratio for the tests was determined to be 30%, and the initial admixture of the polymer was 15%.
3.2. Displacement Changes of SCB Fatigue Test
3.3. Attenuation of Stiffness Modulus with Loading Cycles
3.4. Evaluation and Prediction of Fatigue Life
4. Conclusions
- (1) Based on the SCB strength test results, it shows that the polymer content and sand ratio have significant influence on the flexural strength. The strength increases nonlinearly with the increasing polymer content, rapidly at first and then slowly. However, as the sand ratio exceeds 30%, the flexural strength of the PC decreases.
- (2) According to displacement changes of PC under repeated loadings, the testing process presents three stages, i.e., undamaged stage, damage development stage, and fatigue failure stage, as the number of cycles increases. Moreover, the stress level increases, and the fatigue life and final displacement tend to decrease.
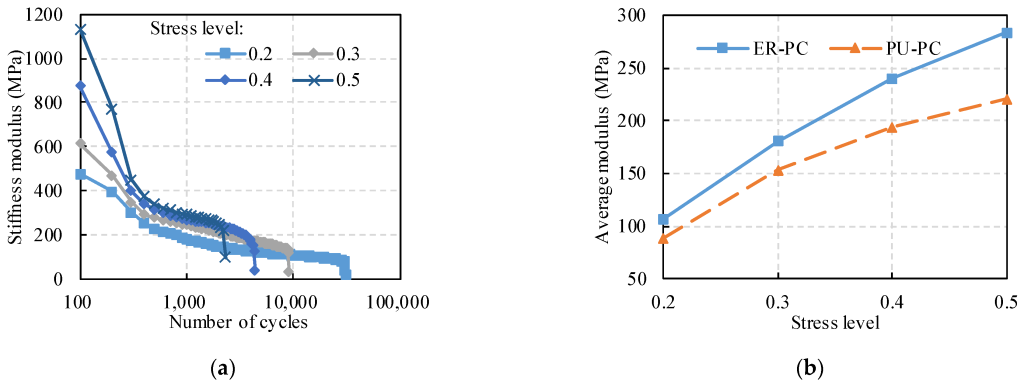
- (3) In terms of the stiffness modulus, the fatigue damage of specimens may result in the decay of the stiffness modulus. Meanwhile, the stiffness modulus is dependent on the stress level. The average modulus of the specimens increases approximately linearly with the increasing stress.
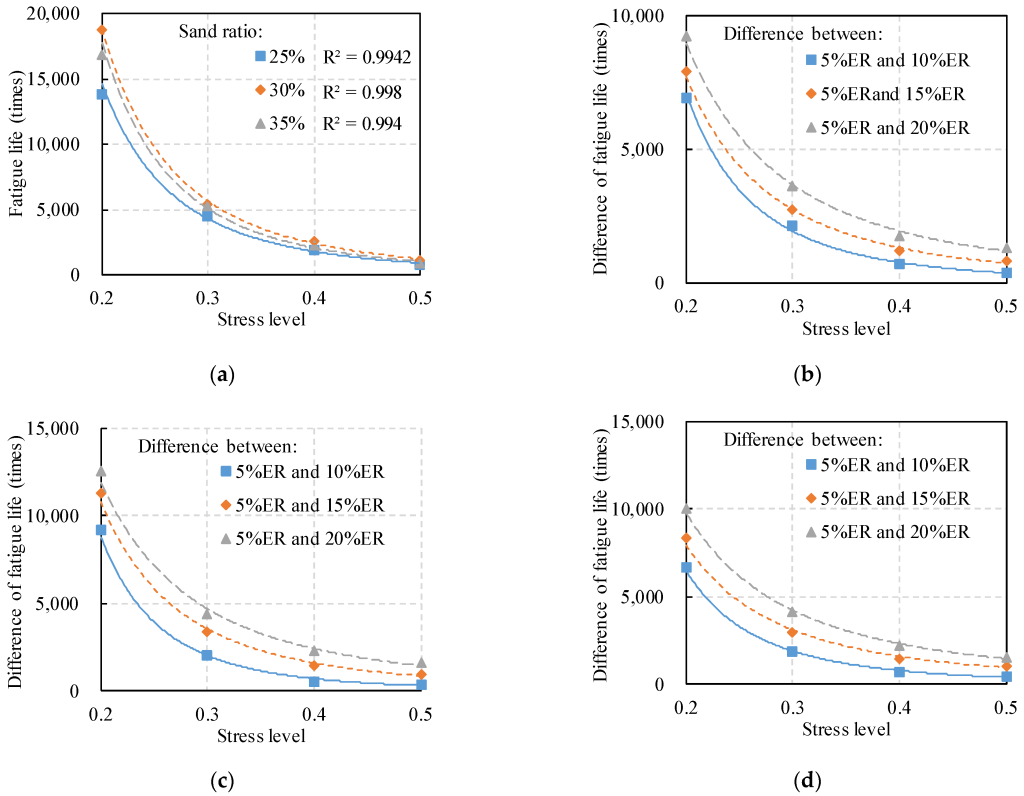
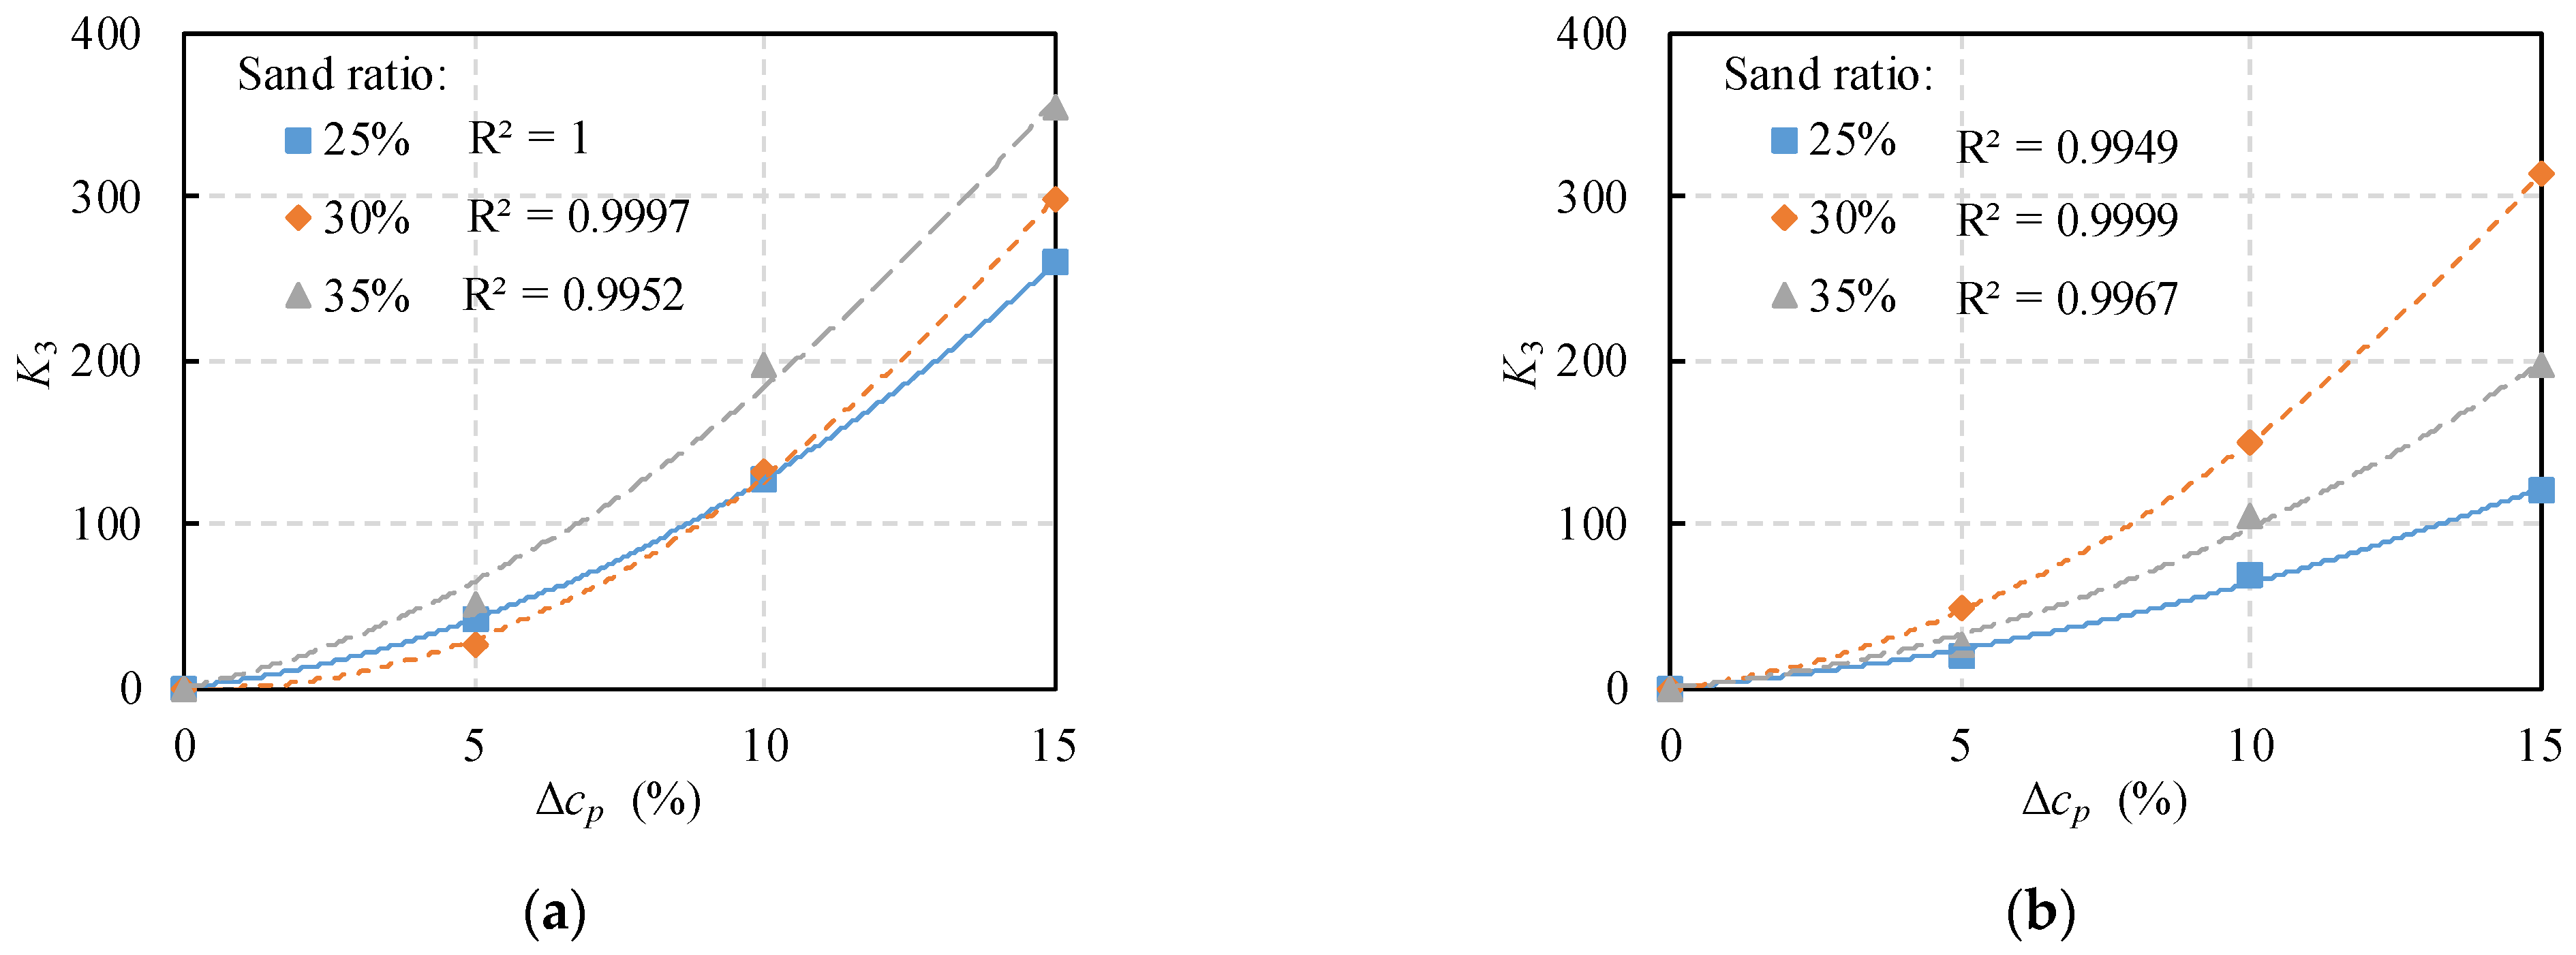
- (4) A prediction model of fatigue life is established containing stress level, polymer content, tensile strength and sand ratio. The basic frame of fatigue life prediction is a power function, and the stress level plays an essential role for the predictability and accuracy.
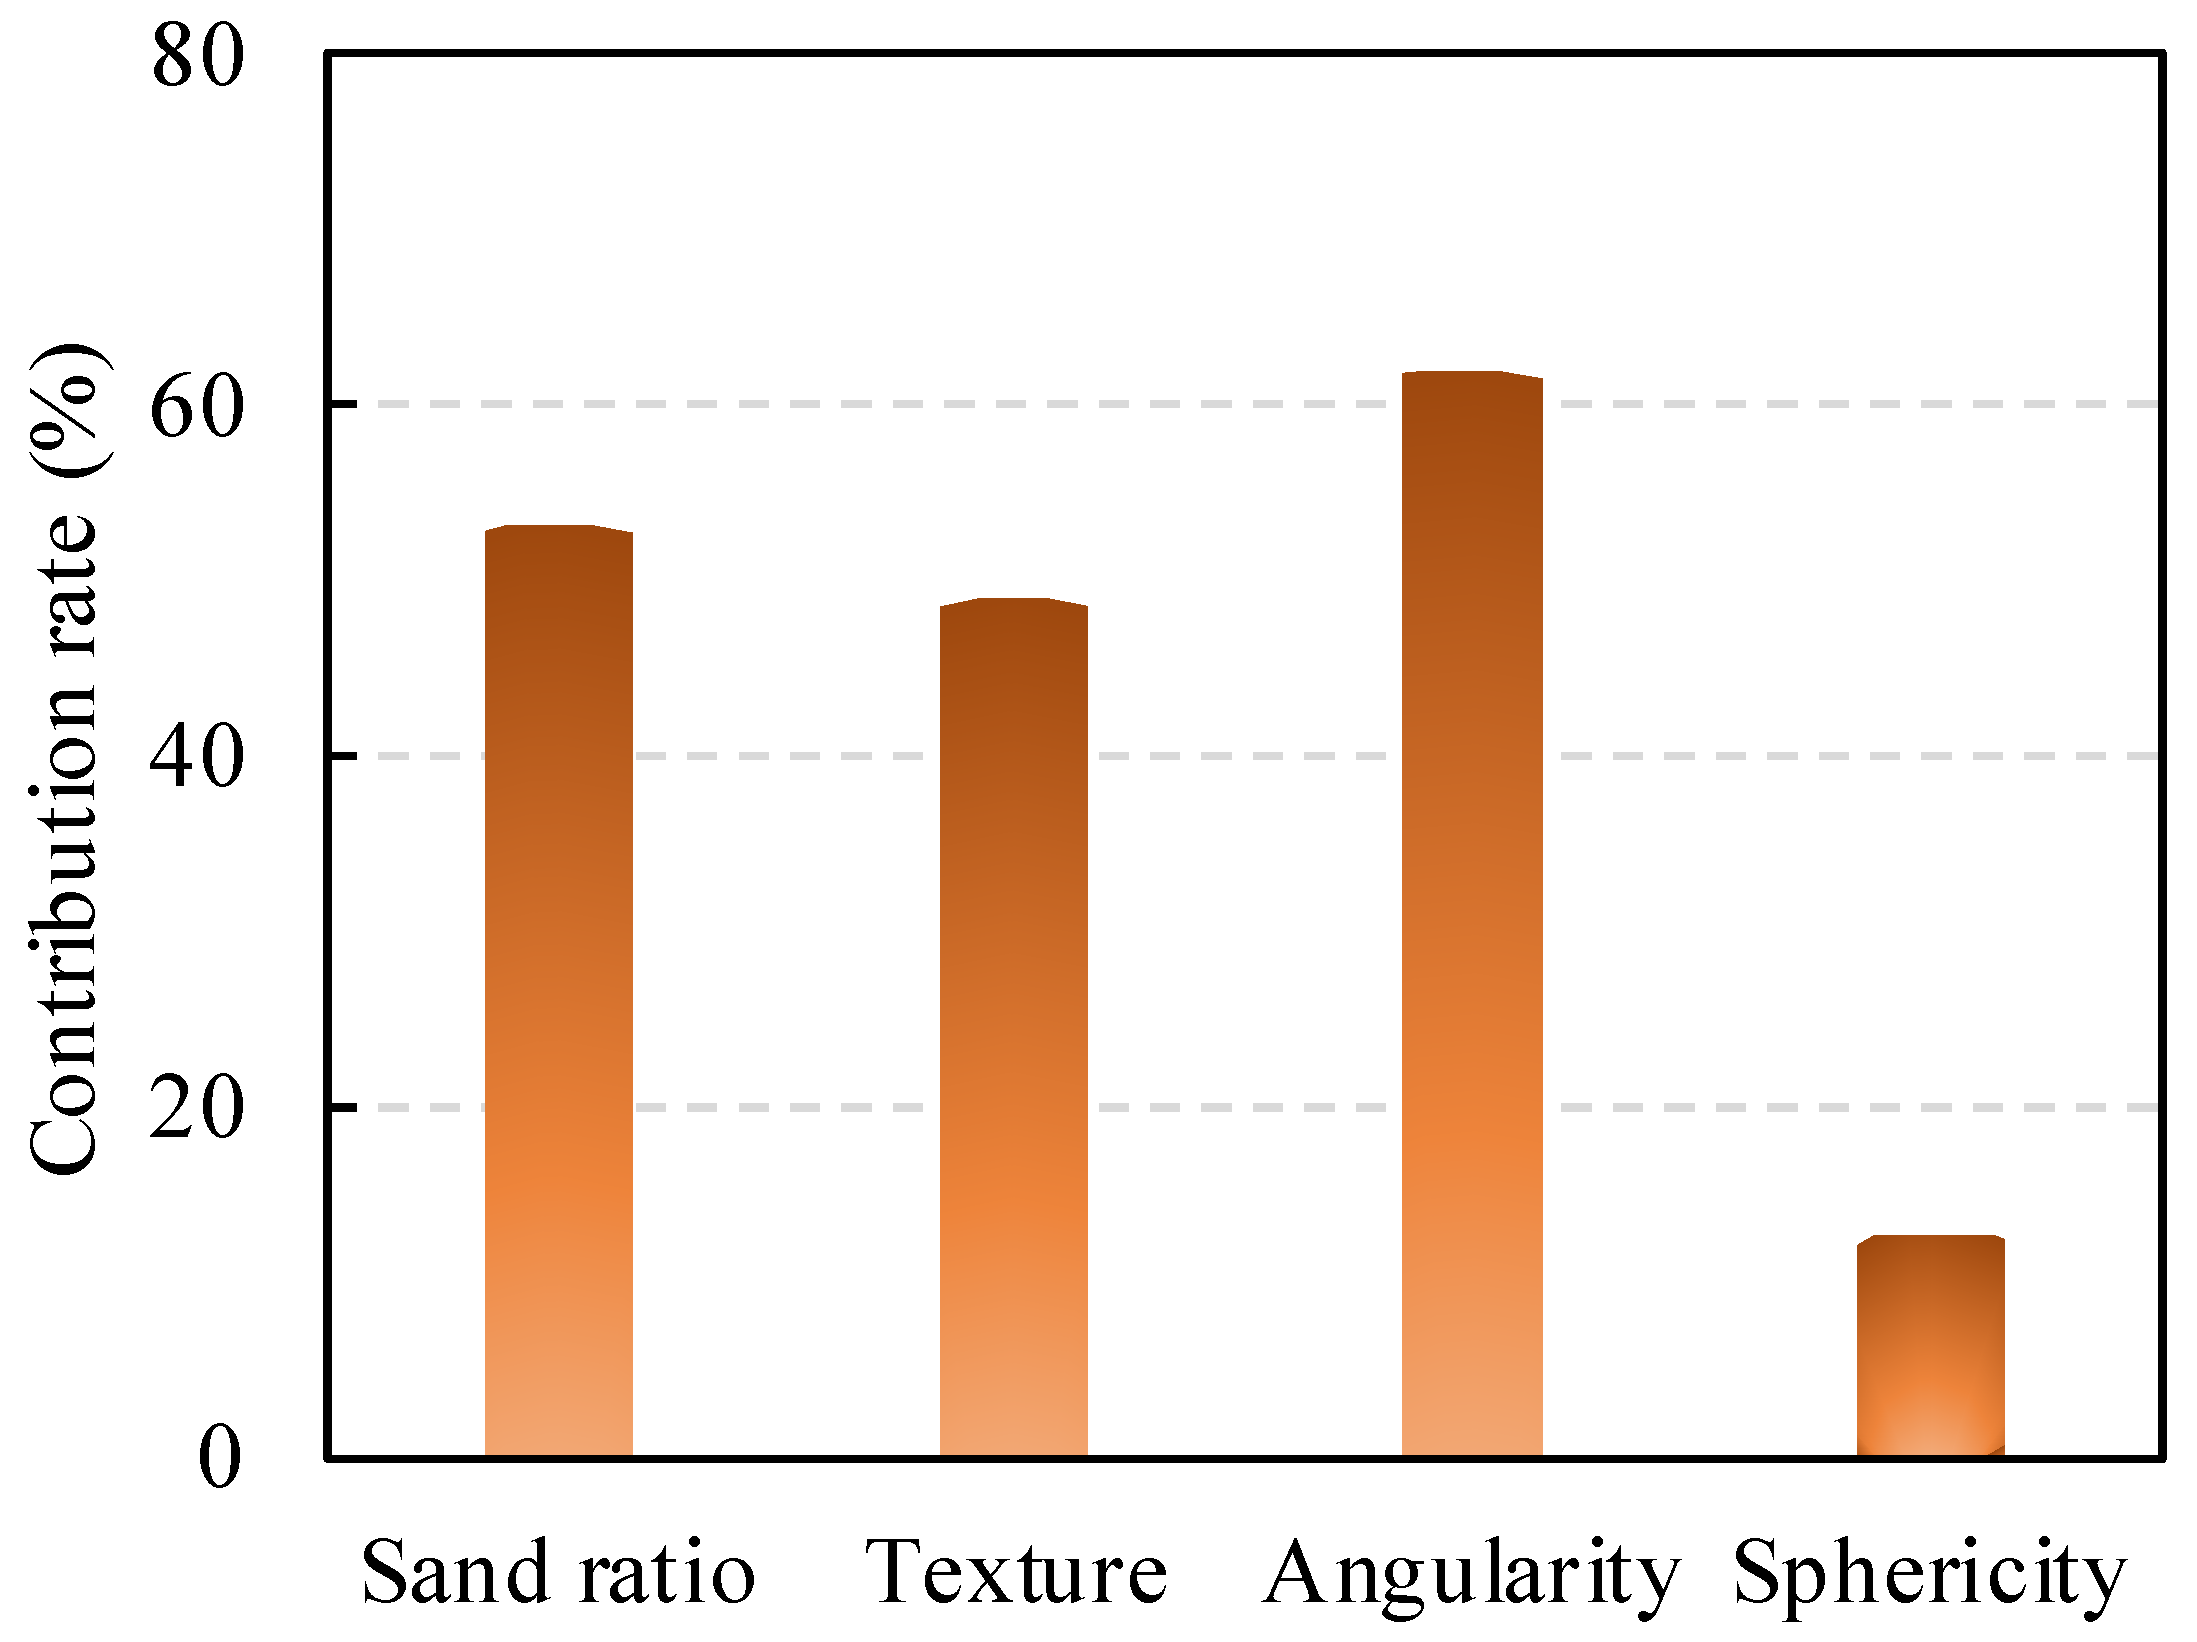
- (5) The fatigue life has a strong correlation with the type of binder and the mixing gradation. Meanwhile, the optimal sand ratio of PC can be determined by the proposed empirical function. According to aggregate shape analysis, the effects of angularity and texture on fatigue life are more significant, whereas the effect of sphericity is relatively weak.
Author Contributions
Funding
Data Availability Statement
Conflicts of Interest
References
- Liu, C.; Lv, S.; Jin, D.; Qu, F. Laboratory investigation for the road performance of asphalt mixtures modified by rock asphalt–styrene butadiene rubber. J. Mater. Civ. Eng. 2021, 33, 04020504. [Google Scholar] [CrossRef]
- Li, J.; Wei, H.; Yao, Y.; Hu, X.; Wang, L. Contribution modeling on condition evaluation of asphalt pavement using uncertainty measurement and entropy theory. Adv. Mater. Sci. Eng. 2021, 2021, 9995926. [Google Scholar] [CrossRef]
- Transport, E.D.o.C.J.o.H.a. Review on China’s subgrade engineering research 2021. China J. Highw. Transp. 2021, 34, 1–49. [Google Scholar]
- Byzyka, J.; Rahman, M.; Chamberlain, D.A. Thermal analysis of hot mix asphalt pothole repair by finite element method. J. Transp. Eng. Part B Pavements 2020, 146, 04020029. [Google Scholar] [CrossRef][Green Version]
- Byzyka, J.; Rahman, M.; Chamberlain, D.A. An improved interface temperature distribution in shallow hot mix asphalt patch repair using dynamic heating. Int. J. Pavement Eng. 2020, 21, 1617–1625. [Google Scholar] [CrossRef]
- Jiang, S.; Li, J.; Zhang, Z.; Wu, H.; Liu, G. Factors influencing the performance of cement emulsified asphalt mortar—A review. Constr. Build. Mater. 2021, 279, 122479. [Google Scholar] [CrossRef]
- Zhang, Z.; Sun, J.; Jia, M.; Ban, X.; Wang, L.; Chen, L.; Huang, T.; Liu, H. Effects of polyurethane thermoplastic elastomer on properties of asphalt binder and asphalt mixture. J. Mater. Civ. Eng. 2021, 33, 04020477. [Google Scholar] [CrossRef]
- Li, M.; Min, Z.; Wang, Q.; Huang, W.; Shi, Z. Effect of epoxy resin content and conversion rate on the compatibility and component distribution of epoxy asphalt: A MD simulation study. Constr. Build. Mater. 2022, 319, 126050. [Google Scholar] [CrossRef]
- Fuseini, M.; Zaghloul, M.M.Y.; Elkady, M.F.; El-Shazly, A.H. Evaluation of synthesized polyaniline nanofibres as corrosion protection film coating on copper substrate by electrophoretic deposition. J. Mater. Sci. 2022, 57, 6085–6101. [Google Scholar] [CrossRef]
- Zaghloul, M.M.Y.M. Mechanical properties of linear low-density polyethylene fire-retarded with melamine polyphosphate. J. Appl. Polym. Sci. 2018, 135, 46770. [Google Scholar] [CrossRef]
- Fuseini, M.; Zaghloul, M.M.Y. Statistical and qualitative analysis of the kinetic models using electrophoretic deposition of polyaniline. J. Ind. Eng. Chem. 2022. [Google Scholar] [CrossRef]
- Zaghloul, M.M.Y.; Zaghloul, M.Y.M.; Zaghloul, M.M.Y. Experimental and modeling analysis of mechanical-electrical behaviors of polypropylene composites filled with graphite and MWCNT fillers. Polym. Test. 2017, 63, 467–474. [Google Scholar] [CrossRef]
- Alhazmi, H.; Shah, S.A.R.; Anwar, M.K.; Raza, A.; Ullah, M.K.; Iqbal, F. Utilization of polymer concrete composites for a circular economy: A comparative review for assessment of recycling and waste utilization. Polymers 2021, 13, 2135. [Google Scholar] [CrossRef]
- Mayhoub, O.A.; Abadel, A.A.; Alharbi, Y.R.; Nehdi, M.L.; de Azevedo, A.R.G.; Kohail, M. Effect of polymers on behavior of ultra-high-strength concrete. Polymers 2022, 14, 2585. [Google Scholar] [CrossRef]
- Cong, L.; Wang, T.; Tan, L.; Yuan, J.; Shi, J. Laboratory evaluation on performance of porous polyurethane mixtures and OGFC. Constr. Build. Mater. 2018, 169, 436–442. [Google Scholar] [CrossRef]
- Chen, J.; Yin, X.; Wang, H.; Ding, Y. Evaluation of durability and functional performance of porous polyurethane mixture in porous pavement. J. Clean. Prod. 2018, 188, 12–19. [Google Scholar] [CrossRef]
- Huang, H.; Pang, H.; Huang, J.; Zhao, H.; Liao, B. Synthesis and characterization of ground glass fiber reinforced polyurethane-based polymer concrete as a cementitious runway repair material. Constr. Build. Mater. 2020, 242, 117221. [Google Scholar] [CrossRef]
- Ma, W.; Zhao, Z.; Guo, S.; Zhao, Y.; Wu, Z.; Yang, C. Performance evaluation of the polyurethane-based composites prepared with recycled polymer concrete aggregate. Materials 2020, 13, 616. [Google Scholar] [CrossRef][Green Version]
- Huang, H.; Pang, H.; Huang, J.; Yu, P.; Li, J.; Lu, M.; Liao, B. Influence of hard segment content and soft segment length on the microphase structure and mechanical performance of polyurethane-based polymer concrete. Constr. Build. Mater. 2021, 284, 122388. [Google Scholar] [CrossRef]
- Zaghloul, M.Y.M.; Zaghloul, M.M.Y.; Zaghloul, M.M.Y. Developments in polyester composite materials—An in-depth review on natural fibres and nano fillers. Compos. Struct. 2021, 278, 114698. [Google Scholar] [CrossRef]
- Hong, B.; Lu, G.; Li, T.; Lin, J.; Wang, D.; Liang, D.; Oeser, M. Gene-editable materials for future transportation infrastructure: A review for polyurethane-based pavement. J. Infrastruct. Preserv. Resil. 2021, 2, 27. [Google Scholar] [CrossRef]
- Naser, M.; Hawileh, R.; Abdalla, J. Fiber-reinforced polymer composites in strengthening reinforced concrete structures: A critical review. Eng. Struct. 2019, 198, 109542. [Google Scholar] [CrossRef]
- Cheng, H.T.; Lee, Y.S.; Liu, H.C.; Lee, W.J. The effect of component addition order on the properties of epoxy resin/polyurethane resin interpenetrating polymer network structure. J. Appl. Polym. Sci. 2021, 138, 49833. [Google Scholar] [CrossRef]
- Guo, T.; Xie, Y.; Weng, X. Evaluation of the bond strength of a novel concrete for rapid patch repair of pavements. Constr. Build. Mater. 2018, 186, 790–800. [Google Scholar] [CrossRef]
- Wei, H.; Li, J.; Hu, B.; Wang, F.; Zheng, J. Influence of temperature on deformation failure and acoustic emission characterisation of asphalt concrete under uniaxial compression. Int. J. Pavement Eng. 2022, 1–10. [Google Scholar] [CrossRef]
- Zhi, S.; Gun, W.W.; Hui, L.X.; Bo, T. Evaluation of fatigue crack behavior in asphalt concrete pavements with different polymer modifiers. Constr. Build. Mater. 2012, 27, 117–125. [Google Scholar] [CrossRef]
- Zaghloul, M.M.Y.; Mohamed, Y.S.; El-Gamal, H. Fatigue and tensile behaviors of fiber-reinforced thermosetting composites embedded with nanoparticles. J. Compos. Mater. 2019, 53, 709–718. [Google Scholar] [CrossRef]
- Zaghloul, M.Y.; Zaghloul, M.M.Y.; Zaghloul, M.M.Y. Influence of Stress Level and Fibre Volume Fraction on Fatigue Performance of Glass Fibre-Reinforced Polyester Composites. Polymers 2022, 14, 2662. [Google Scholar] [CrossRef]
- Yeon, K.-S.; Choi, Y.-S.; Kim, K.-K.; Yeon, J.H. Flexural fatigue life analysis of unsaturated polyester-methyl methacrylate polymer concrete. Constr. Build. Mater. 2017, 140, 336–343. [Google Scholar] [CrossRef]
- Ahn, S.; Jeon, E.-B.; Koh, H.-I.; Kim, H.-S.; Park, J. Identification of stiffness distribution of fatigue loaded polymer concrete through vibration measurements. Compos. Struct. 2016, 136, 11–15. [Google Scholar] [CrossRef]
- Gullapalli, A.; Lee, J.H.; Lopez, M.M.; Bakis, C.E. Sustained loading and temperature response of fiber-reinforced polymer–concrete bond. Transp. Res. Rec. 2009, 2131, 155–162. [Google Scholar] [CrossRef]
- Guo, Q.; Liu, Q.; Zhang, P.; Gao, Y.; Jiao, Y.; Yang, H.; Xu, A. Temperature and pressure dependent behaviors of moisture diffusion in dense asphalt mixture. Constr. Build. Mater. 2020, 246, 118500. [Google Scholar] [CrossRef]
- Zhao, Z.; Wang, S.; Ren, J.; Wang, Y.; Wang, C. Fatigue characteristics and prediction of cement-stabilized cold recycled mixture with road-milling materials considering recycled aggregate composition. Constr. Build. Mater. 2021, 301, 124122. [Google Scholar] [CrossRef]
- Chen, Q.; Wang, S.; Wang, C.; Wang, F.; Fu, H.; Yang, X. Modified waterborne epoxy as a cold pavement binder: Preparation and long-term working properties. J. Mater. Civ. Eng. 2021, 33, 04021079. [Google Scholar] [CrossRef]
- Jung, K.-C.; Roh, I.-T.; Chang, S.-H. Evaluation of mechanical properties of polymer concretes for the rapid repair of runways. Compos. Part B Eng. 2014, 58, 352–360. [Google Scholar] [CrossRef]
- Wang, H.; Zhang, C.; Li, L.; You, Z.; Diab, A. Characterization of low temperature crack resistance of crumb rubber modified asphalt mixtures using semi-circular bending tests. J. Test. Eval. 2016, 44, 847–855. [Google Scholar] [CrossRef]
- Yao, Y.; Li, J.; Ni, J.; Liang, C.; Zhang, A. Effects of gravel content and shape on shear behaviour of soil-rock mixture: Experiment and DEM modelling. Comput. Geotech. 2022, 141, 104476. [Google Scholar] [CrossRef]
- Jiang, J.; Ni, F.; Dong, Q.; Wu, F.; Dai, Y. Research on the fatigue equation of asphalt mixtures based on actual stress ratio using semi-circular bending test. Constr. Build. Mater. 2018, 158, 996–1002. [Google Scholar] [CrossRef]
- Elseifi, M.A.; Mohammad, L.N.; Ying, H.; Cooper III, S. Modeling and evaluation of the cracking resistance of asphalt mixtures using the semi-circular bending test at intermediate temperatures. Road Mater. Pavement Des. 2012, 13, 124–139. [Google Scholar] [CrossRef]
- Shiri, S.; Yazdani, M.; Pourgol-Mohammad, M. A fatigue damage accumulation model based on stiffness degradation of composite materials. Mater. Des. 2015, 88, 1290–1295. [Google Scholar] [CrossRef]
- Li, J.; Zhang, J.; Qian, G.; Zheng, J.; Zhang, Y. Three-dimensional simulation of aggregate and asphalt mixture using parameterized shape and size gradation. J. Mater. Civ. Eng. 2019, 31. [Google Scholar] [CrossRef][Green Version]
- Yao, Y.; Li, J.; Liang, C.; Hu, X. Effect of coarse recycled aggregate on failure strength for asphalt mixture using experimental and DEM method. Coatings 2021, 11, 1234. [Google Scholar] [CrossRef]
